Update from Will #2: Graph Architecture & Integrations, Building A Dashboard, and Videos
William Lyon / November 28, 2020
3 min read
Hi folks!
It was a short week in the US for the Thanksgiving holiday but I wanted to send out an update of what I've been working on.
Neo4j Connections: Graph Architecture and Integrations#
Last week I had the pleasure of presenting along with my colleague David Allen at the Neo4j Connections: Graph Architecture and Integrations event. In our keynote presentation we gave an overview of the new Neo4j Connectors that enable using Neo4j in your existing architecture as well as a look at what's going on inside Neo4j Labs, which is where I spend most of my time. You can find the recording of our talk "Extending The Reach Of Graphs" here on YouTube.
There were several great talks throughout the event showing how to use Neo4j with other technologies like Spark, Kafka, and Business Intelligence tooling but my favorite talk of the day was from Will Reynolds at Hoare Lea talking about how they use Neo4j and GraphQL to realize what he calls the "Building Graph" - a GraphQL API of data from multiple systems for modeling the complex systems within buildings and their design.
You can find the recording of his talk "Utilizing The GRANDstack: Neo4j And GraphQL In The Real World" on YouTube as well.
Building An Election Night Dashboard#
One thing I'm thankful for this year is all the amazing tooling available in the Neo4j ecosystem. Between integrations with data pipeline systems, language and framework specific integrations, and cloud services building an application with graphs has never been more accessible for developers. However, one area of Neo4j tooling that makes graphs even more accessible are the "low-code" graph apps available within Neo4j Desktop.
This week I wrote a blog post showing how to use some of these low code graph app tools to build an election night dashboard using Neo4j.

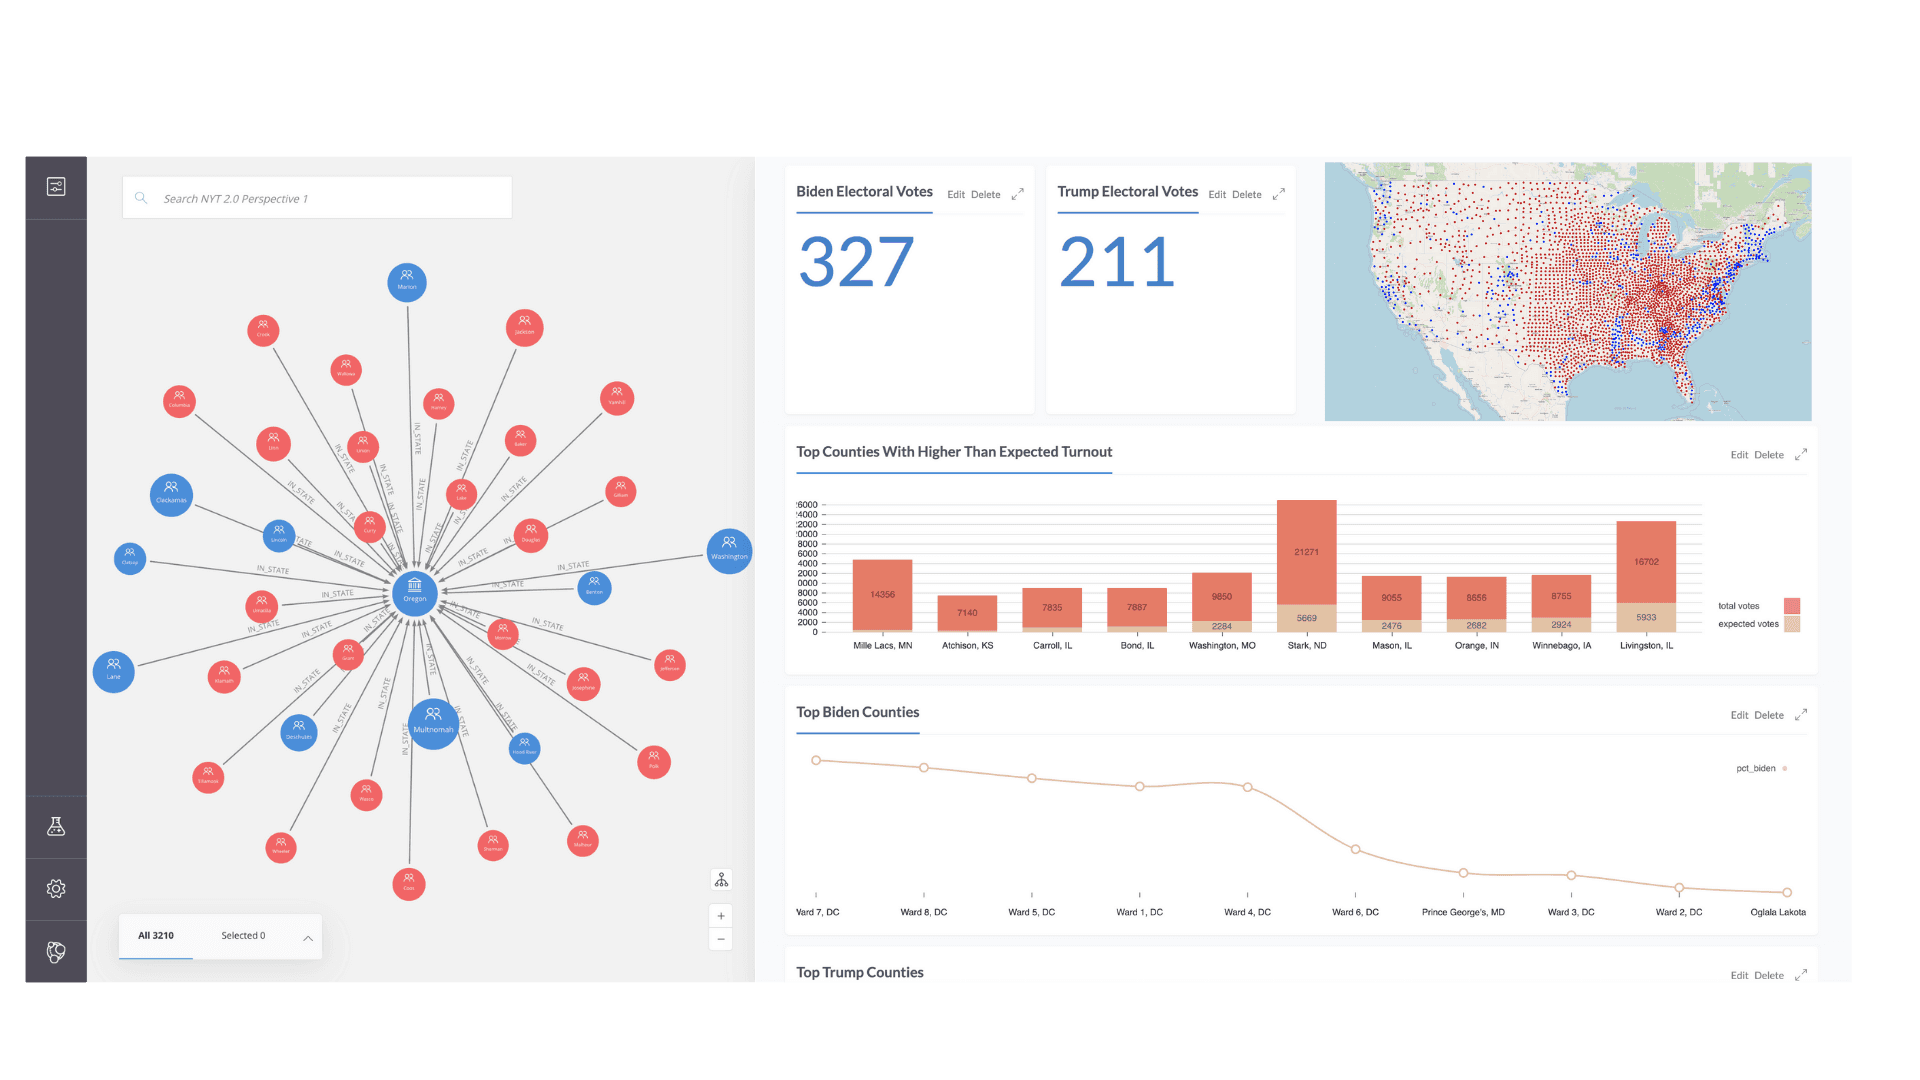
Building An Election Night Dashboard With Neo4j Graph Apps: Bloom, Charts, And Neomap
November 28, 2020 • 12 min read
Using low code graph apps to build data visualizations with Neo4j.
New Video Page#
I wanted to highlight some of the video content I've been working on so I added a searchable video page to my site. Here you can find recordings of past livestreams, conference talks, screen casts, and other videos including relevant links and resources mentioned in the video as well as transcripts. I've added most live stream recordings so far but I'll be adding more videos going forward. You can find that page at lyonwj.com/videos
What I'm Reading#
I finished reading the book Billionaire Wilderness. The author is a Yale sociologist who looks at the impact of the super-wealthy moving to and buying large amounts of property in the American West, specifically Wyoming and Montana. At times it can read like a long sociology paper, however there is a very interesting section that applies social network analysis to non-profit tax filing data to show that the foundations and charities being set up by these super-rich transplants mostly benefit themselves.
That's all for now - if you're celebrating Thanksgiving I hope you had a great holiday and weekend!
Cheers, Will
Subscribe To Will's Newsletter
Want to know when the next blog post or video is published? Subscribe now!